Debugging WordPress & ACF
#Introduction
Debugging is an unavoidable task when developing an application. It can be long, tedious and exhausting as it often requires reverse-engineering mechanism, which means reassembling the source code rather than unwinding it in a logical sense. This process requires more concentration and resources than typical coding.
In this guide we’ll learn how to set up a favorable environment in order to make it simpler and more bearable, following these simple steps:
- Backup your website
- Choose a development environment
- Enable the WP Debug mode
- Watch your debug file
- Actually debug your code
This guide may seem lengthy at first. But once you have all the concepts down, your debugging process will become much more efficient.
#Backup your Website
We can never stress this enough: Backup your website. A good developer is a paranoid developer, because even a tiny change may have unpredicable consequences on other parts of your website.
Most hosting solutions provide a built-in backup solution. If that’s not your case, you can use the great Duplicator plugin. It’s free and it will let you migrate your website on another server, or your development environment, with an easy installation process.
#Development Environment
Once you found your backup solution, you’ll have to install a copy of your website on a development environment. This way you can make any change without the worry of breaking your website on production.
There’s typically two different environments to debug your site:
A local development environment is a web server that is installed on your computer. It will run your website just like a normal hosting provider, but the website will be only available to you. To setup such environment, we strongly recommend Laragon for Windows users.
This free application let you setup a fully-fleshed local web server, which comes with dozen of handy features, such as: Apache/Nginx, PHP selector, MySQL with PHPMyAdmin, Mail catcher + SMTP, Memcache/Redis, NodeJS, local SSL, Logs Viewer and more!
For Mac users, MAMP is an excellent alternative.
Some hosting solutions provide an easy “staging” migration tool. This feature will clone your website on a private Internet URL, allowing developers to debug or make some tests without breaking the production website.
Please refer to your hosting provider documentation or contact its support for more information.
While using a staging environment is fast and easy, having a proper local environment on your computer has some great advantages. To name a few: you have direct access to your files & database which means you don’t have to deal with FTP files transfert. You don’t even have to rely on your Internet connection to test your changes, since everything is local.
This removes a lot of hassle, as you can use your favorite code editor to update your files and instantly see the changes. You may also search specific terms/errors within all your source code at once.
The downside is that you can’t easily share your environment with a third-party user, or migrate back to production in one-click. However, the Duplicator plugin will make this process very easy.
#WP Debug Mode
Once your website is installed on your development environment, you can enable the WP Debug mode using the following code in the wp-config.php file, right before the “Happy publishing” comment:
define('WP_DEBUG', true);          // enable debug
define('WP_DEBUG_LOG', true);      // enable error logs
define('WP_DEBUG_DISPLAY', false); // disable errors on screen

/* That's all, stop editing! Happy publishing. */
You can read more about the WP Debug Mode on the WordPress documentation.
What this configuration does:
WP_DEBUGenable the usage of next two settings:WP_DEBUG_LOGtells WordPress to write PHP errors in a log fileWP_DEBUG_DISPLAY (false)tells WordPress to hide errors on the screen
With this setup, WordPress will log PHP errors in this file: /wp-content/debug.log. It will be created the first time a PHP error occurs.
The last setting WP_DEBUG_DISPLAY (false) is quite important, because errors displayed on the screen may break important websites features, such as redirections. That’s why it is recommended to log them instead.
Note: Some custom server configuration may force WordPress to move the log file somewhere else. If the default file /wp-content/debug.log has not been created, even when an error should be there, then please contact your hosting support for further information.
Javascript errors are displayed in your browser console (F12 on chrome). To debug it, it’s recommended to enable the SCRIPT_DEBUG constant in the wp-config.php file, right before the “Happy publishing” comment:
define('SCRIPT_DEBUG', true); // enable JS debug

/* That's all, stop editing! Happy publishing. */
You can read more about SCRIPT_DEBUG on the WordPress documentation.
This constant tells WordPress to load unminified Javascript files. This is useful because minified files are unreadable most of the time. Functions are renamed to be shorter, spaces are removed and all the code is compressed into one single line.
Minified files errors typically look like:
Uncaught t54ab ReferenceError not defined          // function name: t54ab
at /wp-content/themes/my-theme/script.min.js       // line 1, character 1557
Loading unminified files will make your research easier, as errors will look like:
Uncaught do_something ReferenceError not defined  // function name: do_something
at /wp-content/themes/my-theme/script.js // line 366, character 30#Watch Debug File
Now that your WordPress logs errors in the debug file, you can enjoy a nice feature which let you see new errors on-live, while browsing your website. This is particulary useful if you have warnings/errors that are only triggered in specific use case.
We recommend TailBlazer App for Windows users (which is bundled within Laragon). It will let you select the file and instantly watch errors.
Otherwise, you can run this command on Windows/Mac to watch a file in-live:
tail -f "C:/local/www/website.dev/wp-content/debug.log"You can also run the same command using your server SSH access on your staging environment:
tail -f "etc/www/website.com/wp-content/debug.log"#Debugging Code
Now that you have a comfortable environment, you can actually debug your code. The most basic way to log a variable into the debug.log file is to use the PHP native function error_log() (see documentation). But in this guide, we’ll focus on a derived function which is way more powerful.
ACF comes with a very handy function named acf_log() which lets you log any message/variable/array/object/etc… It is the equivalent of the native PHP error_log() but it supports multiple logs, booleans, array and other complex types.
Here are some usage examples:
acf_log('my message');[24-Oct-2022 17:41:22] my messageacf_log('my array', array('test'), 'my message');[25-Oct-2022 22:12:13] my array Array
(
[0] => test
) my messageadd_filter('acf/prepare_field/name=my_field', 'my_prepare_field');
function my_prepare_field($field){
acf_log($field);
return $field;
}[12-Jan-2022 04:31:00 UTC] Array
(
[ID] => 0
[key] => field_61d5cab9b6a3a
[label] => Text
[name] => text
[prefix] => acf
[type] => text
[value] =>
[menu_order] => 2
[instructions] =>
[required] => 0
[id] =>
[class] =>
[conditional_logic] => 0
[parent] => field_61d5cab2b6a39
[wrapper] => Array
(
[width] =>
[class] =>
[id] =>
)
[default_value] =>
[placeholder] =>
[prepend] =>
[append] =>
[maxlength] =>
[acfe_settings] =>
[acfe_validate] =>
[acfe_field_group_condition] => 0
[_name] => text
[_valid] => 1
)#Testing Isolated Code
When developping or debugging a feature, you’ll often need to know how a small chunk of code is supposed to work, just to make sure the output is correct before going further. For example, when dealing with merged arrays or when doing queries with WP_Query.
You could test these small codes directly in your functions.php file and log the ouput with acf_log() as we’ve seen above. However, this process will become tedious, since you have to edit your functions.php file, refresh your browser and finally see the results in the logs.
There is an alternative approach which is called Tinkerwell. This application creates an isolated code editor connected to your WordPress, and let you execute some code with the result in live.
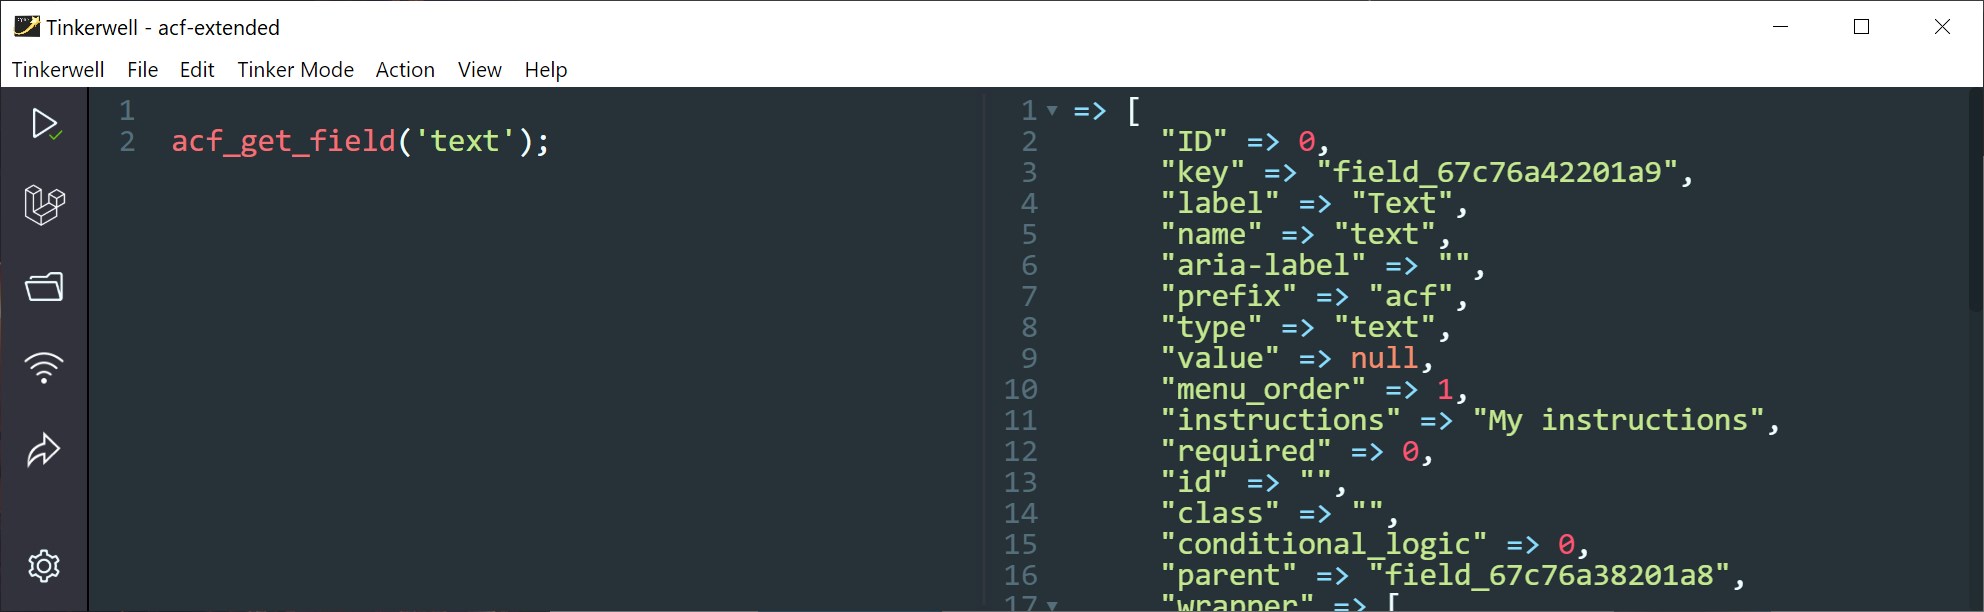
The beautiful part is that it is working within your local WordPress installation context, which means functions such as get_option('admin_email') or WP_Query() will work and display actual values from your database.
The counter-part of Tinkerwell for Javascript is called RunJS. It will let you test small Javascript code the same way, with live preview. There is a downside tho, as there is no way to add jQuery or the ACF JS API at the moment.